Article Overview
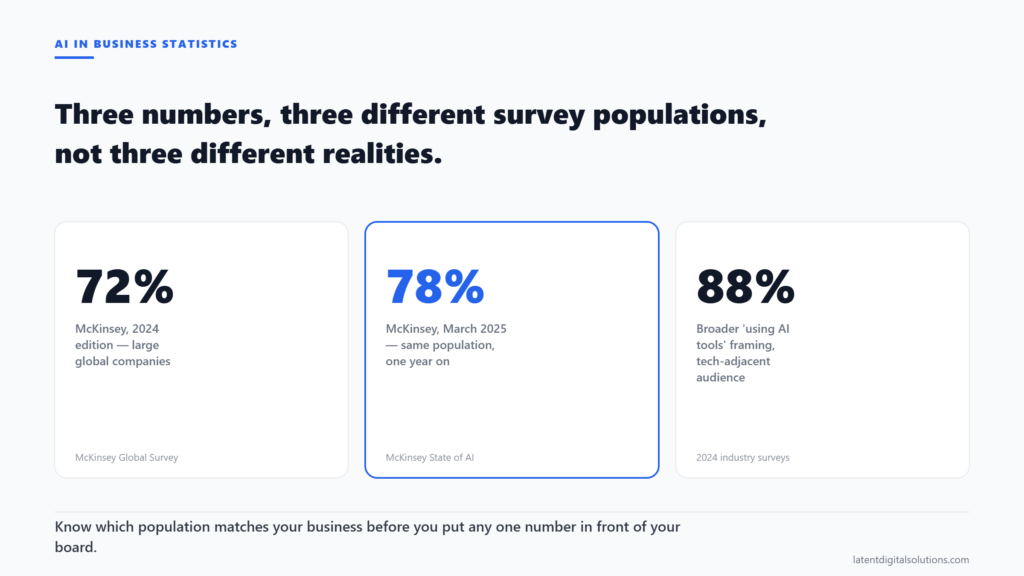
AI in business statistics quoted as 72%, 78%, and 88% by three credible sources are not contradictory — each figure describes a different survey population, not a different reality. Knowing which population matches your organisation’s size and sector is what makes any single number safe to put in front of a board.
UAE businesses building the case for AI investment run into this problem early: the board or the finance team asks for a number, the available numbers contradict each other, and the person presenting cannot explain the gap. This article does not add a fourth number to the pile of AI in business statistics. It explains what the existing ones count, so you can choose the one that is accurate for your situation.
Key takeaways
- 01.Three credible sources quote AI adoption at 72%, 78%, and 88% — the gap comes from different survey populations, not different realities.
- 02.McKinsey’s 2025 State of AI survey reports 78% of organisations used AI in at least one business function, up from 55% the year before — respondents were senior leaders at large global companies.
- 03.EU Eurostat’s 2025 enterprise census counts 20.0% of all EU enterprises as AI users — a census of legal entities, not a self-selected survey of AI-forward businesses.
- 04.No comparable official census exists for UAE enterprises at the size-band level; the most credible UAE-adjacent figure is the government’s own AI Economy targets.
How many businesses actually use AI?
The most-cited AI in business statistics as of 2026 are these three:
72% — McKinsey & Company’s Global Survey on the State of AI, 2024 edition, which reported that 72% of respondents said their organisations had adopted AI in at least one business function. Population: senior managers at large global companies who opted into a McKinsey survey panel.
78% — McKinsey’s March 2025 survey, “The state of AI: How organizations are rewiring to capture value,” reporting that more than three-quarters of respondents said their organisations use AI in at least one business function — up from 72% the prior year, and 55% two years earlier. Same population, later in its adoption curve.
88% — the third of the three headline AI in business statistics, circulated from various 2024 surveys targeting technology-adjacent business audiences, where the framing shifted from “adopted AI in at least one function” to “using AI tools in some capacity.” The broader definition produces a higher percentage.
20.0% — Eurostat’s own 2025 enterprise survey (ec.europa.eu, retrieved September 2026), which found 20.0% of EU enterprises with 10+ employees used AI technologies in 2025 — up from 13.5% in 2024. This is a survey of all qualifying legal business entities, not a self-selected panel of AI adopters.
These AI in business statistics are all technically correct. They describe different populations.
Why do the headline numbers disagree?
AI in business statistics disagree because “businesses using AI” can mean at least three different things, and each survey picks one without always stating it:
Self-selected survey respondents vs a statistical census. A survey panel that McKinsey administers reaches executives who are already thinking seriously about AI adoption. A census of all EU legal entities — from a sole trader with five employees to a multinational — reaches a much wider population that includes businesses that have never seriously considered AI. You would expect a survey of AI-aware leaders to produce higher adoption rates than a census of the general business population.
“At least one function” vs “any tool.” An organisation that runs one AI-assisted report once a quarter qualifies under the broader definition. So does one that has deployed six AI systems across operations. The number treats both the same.
Year of measurement. A survey completed in early 2024 and published mid-2024 reflects adoption as of late 2023 or early 2024. The same organisation reporting in 2025 shows a 23-percentage-point jump — adoption genuinely grew, but the comparison also reflects improved survey coverage of a fast-moving space.
According to McKinsey’s March 2025 survey (mckinsey.com, retrieved September 2026), more than three-quarters of organisations reported using AI in at least one business function, up from 72% the year before and 55% the year before that. That two-year climb alone illustrates how quickly the headline number changes — and why a figure from 2023 is probably already stale in any board paper written today.
What changes when you split by company size?
Significantly. Any headline AI in business statistics figure — whichever one you use — aggregates companies of very different sizes and resource levels.
Eurostat’s 2025 enterprise census shows a consistent pattern across EU member states: adoption by large enterprises (250+ employees) runs at roughly three times the rate of small enterprises (fewer than 50 employees). The pattern appears in every sector Eurostat measured. Large firms have dedicated IT staff to evaluate and deploy tools; small firms generally do not.
This matters for a UAE business building an internal case. If your organisation has under 100 employees, a headline figure based on surveys of large global companies is not your reference point. It describes a different population. The more useful question is: what does adoption look like at companies of your size, in your sector, with your existing IT infrastructure?
| Company size | AI adoption pattern | Why it matters for planning |
|---|---|---|
| Large (250+ employees) | High | Dedicated IT resource, budget, and procurement process |
| Medium (50–249 employees) | Mixed | Some have IT teams, most don’t |
| Small (<50 employees) | Low | Adoption is per-tool, not programmatic |
Latent’s AI Transformation work focuses on this gap: the point where a business is large enough that AI creates real operational gains, but not so large that it has its own data science team. The starting point is always the specific operation, not the headline adoption rate.
What do we know about the UAE specifically?
Less than general AI in business statistics coverage suggests.
There is no Eurostat equivalent for the UAE — no independent census of UAE enterprises by AI adoption rate, broken down by size band. The AI in business statistics that do exist for the UAE are mostly from two sources:
UAE government targets. The UAE AI Strategy 2031 and the Dubai AI Roadmap set forward-looking targets for AI contribution to GDP. These are policy aspirations, not current adoption measurements.
Survey-based estimates. Various consultancy reports cover MENA or GCC adoption broadly — the World Economic Forum’s Future of Jobs Report 2025 (weforum.org, retrieved September 2026) notes that AI and information processing technologies are among the fastest-growing job-displacing and job-creating forces globally, with adoption accelerating fastest in markets that have made significant public investment in AI infrastructure — a category that includes the UAE. These remain the closest UAE-adjacent AI in business statistics currently available.
PwC’s Middle East Workforce Hopes and Fears Survey 2025 (pwc.com, retrieved September 2026) found that 32% of regional workers use generative AI tools daily — above the 28% global average — but the survey does not disaggregate UAE from the broader regional sample. What this means in practice: any claim about UAE-specific AI adoption rates that cites a precise percentage should be read carefully. Check who was surveyed, when, how many UAE respondents were included, and what exactly they were asked. For internal business cases, government-published AI adoption targets are generally the safest citation — they are primary sources, they carry official weight, and they are honest about being targets rather than measured outcomes.
The AI Transformation Roadmap for UAE businesses sets out what that journey looks like operationally — which is more useful for an internal AI case than a headline adoption percentage that may or may not describe organisations like yours.
Which figures are safe to put in a board paper?
Three criteria decide which AI in business statistics are safe to cite: the figure is from a primary source, the population is described, and the publication date is within the last 18 months.
AI in business statistics safe to cite as of September 2026:
– McKinsey State of AI 2025: 78% of large organisations used AI in at least one business function — primary source, dated, population identified as senior executives at global companies.
– Eurostat 2025: 20.0% of EU enterprises used AI technologies — primary census, dated, population is all EU legal enterprises.
– WEF Future of Jobs 2025: directional statements about AI adoption acceleration in high-investment markets — primary source, dated, useful for framing but not a precise adoption percentage.
Not safe to cite in a board paper without checking:
– Any AI in business statistics figure from a secondary article (“according to a study…”) without a link to the original source.
– Any figure more than 18 months old — the field moves fast enough that 2023 data is often misleading when applied to 2026 decisions.
– Any adoption percentage applied to “UAE businesses” without a UAE-specific survey source.
The safest approach when citing AI in business statistics for an internal AI business case is to use one figure, cite it correctly, and be explicit about what population it describes. A board that understands the number will trust it more than one that is given an impressive percentage without context. In Latent’s experience preparing AI business cases for UAE clients, the most common mistake is citing a global survey average as evidence of what “similar businesses” are doing — the survey population almost never includes companies of the same size, sector, and geography as the organisation making the case. Knowing what the number actually measured is the only thing that makes it safe to use in the room.
Once you have the right framing, the AI Readiness Assessment Framework gives a structured way to move from “what the statistics say” to “what this means for our specific operation.”
Start the conversation if you are building an internal AI case and want help identifying which metrics are relevant to your organisation’s specific situation.
Conclusion
The AI in business statistics that circulate most widely — 72%, 78%, 88% — are all real figures from credible sources. They disagree because they measure different things. A census of all EU enterprises produces a 20% adoption rate. A survey of senior executives at AI-forward global companies produces a 78% rate. Both are correct for their populations.
For a UAE business building an internal case, the most useful AI in business statistics are the ones that match your organisation’s size, sector, and geography. The headline global figure is a starting point for context, not a benchmark for your own decisions.
Frequently Asked Questions
What are the current AI in business statistics for 2026?
It depends on the source and what it measures. McKinsey’s 2025 State of AI survey of large global organisations reports 78%. Eurostat’s 2025 enterprise census of all EU businesses reports 20.0%. The gap reflects different populations: self-selected surveys of AI-forward executives versus a census of all legal business entities. Neither is wrong — they describe different groups.
Why do AI adoption statistics vary so much between sources?
Three factors drive most of the variation: who was surveyed (an executive panel vs a full census), what counts as “using AI” (one function vs any tool at all), and when the data was collected (a year’s difference can represent a 20-percentage-point shift in self-reported adoption). Any reputable statistic should name all three. If a cited figure does not, it is incomplete.
Are there reliable AI in business statistics for UAE businesses specifically?
There is no Eurostat-equivalent UAE enterprise census by AI adoption rate broken down by company size. The most reliable UAE-specific data comes from government strategy documents (UAE AI Strategy 2031, Dubai AI Roadmap), which set forward-looking targets rather than measuring current adoption. Consultancy reports covering MENA or GCC broadly are the next best option, but check who was surveyed and how many UAE-specific respondents were included.
Is 2023 AI adoption data still useful in 2026?
For context, yes. For citing in a current business case, generally no. McKinsey’s own data shows a 23-percentage-point jump in adoption between their 2023 and 2025 surveys. A 2023 figure presented without a date can mislead a decision-maker about the current environment. Use figures from the last 18 months where possible.
Which AI in business statistics are safe to use in a board presentation?
Any figure where you can answer: who was surveyed, when, and what they were asked. McKinsey State of AI 2025 and Eurostat’s 2025 enterprise report both meet this test. Avoid secondary citations (“according to a study”) without a link to the original. Avoid applying global figures to UAE-specific claims without a UAE-specific source.
How do I compare my organisation’s AI maturity to these AI in business statistics?
The aggregate adoption rate does not tell you much about your own position. More useful is knowing whether your specific use case — the task, the data, the workflow — is one that AI handles reliably at your size and sector. Start with a specific operational question, not a comparison to an industry average.
Usually a reply within one working day.